 Dipuo Magapa
1 min read
Planning Ukraine's Energy Reform
How PLEXOS facilitates Ukraine's integration into Europe's power market Ukraine, Europe's second-largest country by area, is one of the most...

Case study is based on the work presented at the Xcelerate Barcelona conference by Dipuo Magapa, Senior Energy Planner at Eskom
Eskom is a state-owned, vertically integrated utility that has been powering much of South Africa for the past 100 years. However, Eskom is currently transitioning from being the sole electricity provider for South Africa to one that enables further generation in South Africa with the Just Energy Transition (JET) programme.
The JET programme aims to reach net-zero emissions by the year 2050 – doing better for people and the planet, growing local industrialisation, providing cleaner, more sustainable energy, and transforming businesses.
Eskom has 46,152 MW of operational capacity, about 80% of which is from coal-fired generation. The remaining operational capacity comes from nuclear, open cycle gas turbines, hydro and pumped storage, wind, and solar. This year, South Africa’s demand forecast predicts a 34 GW peak demand, and over 227 TWh of energy demand. Most of the country’s coal is in the northern part of South Africa and must be transported to the Southern part of the country.
To meet JET targets, Eskom must determine how to drastically change the makeup of its generation stack. Additionally, not only does the organisation need to maintain adequacy, but it also needs to restore its power system to adequacy - South Africa is currently experiencing approximately 6,000 MW of load shedding and rolling blackouts a day due to poor performance of its power stations.
Faced with a requirement to both transform Eskom’s generation stack, and restore system adequacy, Eskom’s Energy Planning Unit, which performs both capacity expansion and short-term planning for the utility, wanted to carry out a high-level update of the assumptions used in the previous JET study. The JET study is performed once a year, simulating up to the year 2050 within specified constraints, across various scenarios to provide insights into:
Eskom has been using Energy Exemplar’s PLEXOS solution for more than 14 years. PLEXOS, an energy modelling and simulation tool, is used widely across the organisation in its Energy Planning, Production Planning, System Operations, and Transmission Pricing units for a wide range of studies and horizons.
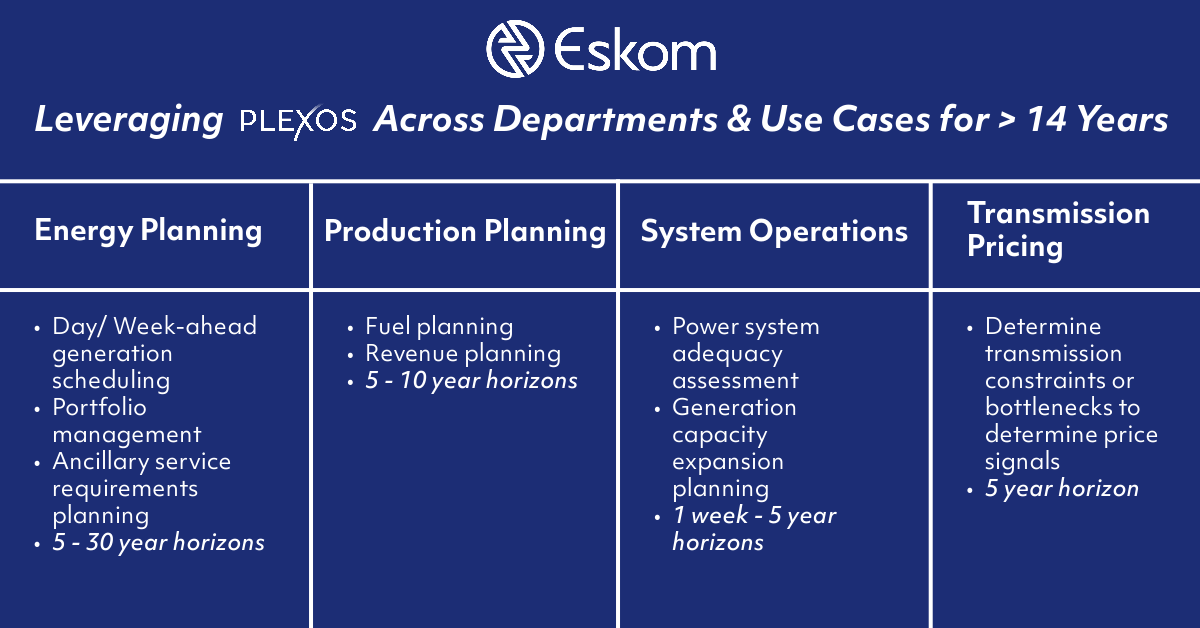
The Production Planning group performs short and medium-term fuel and revenue planning studies with PLEXOS with horizons of five to ten years. The System Operations group leverages PLEXOS for day-ahead and week ahead generation scheduling, portfolio management, and ancillary services requirements planning. Study horizons range from a week for national operations, up to five years for ancillary services. The Transmission Pricing group uses PLEXOS to determine transmission constraints or bottlenecks to determine price signals over a 5-year horizon.
The Energy Planning group uses PLEXOS for its power system adequacy assessment, generation capacity expansion planning, and for JET planning. The Energy Planning Group’s Capacity Expansion Plan spans a horizon of about 30 years, and its power system adequacy assessment spans a five-year horizon.
Planning for new capacity expansion has evolved significantly over the years at Eskom. Traditionally, studies were carried out using the load duration curve approach to sample chronology, and sometimes full chronology. However, since study techniques significantly impact expansion plans, fidelity of variable renewable resources, simulation, and computational requirements, the Energy Planning team wanted to benchmark long-term formulation using Integer Sampled Chronology vs. Linear Relaxation Sampled Full Chronology for the JET in PLEXOS.
Testing different techniques will allow the group to reach accurate results when simulating the South African power system up to the year 2050 - ensuring an optimal future energy mix, accounting for possible shutdown rates, realistic build rates, and constraints so that the country obtains the capacity required to restore its power systems adequacy. The group also wanted to reduce the study’s runtime if possible.
To test Integer Sampled Chronology vs. Linear Relaxation Sampled Chronology, the Energy Planning group looked at three variable study outcomes – model run time, VRE production profile and load profile, and build plan.
To cut down model run time, the group decided to capture renewable variability by aggregating renewable power plants by type and generation profile – conventional power plants were not aggregated. The team ran the study using both techniques on physical 500 GB RAM servers with 72 logical processors. The integer method was run with 9 days per year, and the linear relaxation sampled chronology was run with 365 days per year.
Running the study with the integer sampled chronology resulted in a runtime of 3 hours and 15 minutes. Whereas the linear relaxation sampled chronology had a runtime of about five days.
In terms of the VRE production and load profiles, REIPPP Bid Window 1 - 4+ profiles were modelled with their profiles, and an energy demand forecast with AGR of 1.6% up to 2050 was assessed.
The integer optimisation method showed huge variation of the hourly load profile, whereas the sampled chronology method results aligned with the actual load profile in terms of load shape, with only minor variations in seasons. Additionally, the integer optimisation method did not result in wind profile ramping that aligned with the actual and sampled chronology. The integer method also resulted in solar PV over generating in all periods, and with variation in some. The sampled chronology solar profile was smooth and had stronger production than the actual. The sampled chronology also showed a better representation of the actual profile with full chronology of 365 days a year – it also had residual production around 5 AM in line with the actual solar PV profile.
Lastly, the team assessed the optimised plan produced by both methods, checking the quantum and type of the technologies considered.
This analysis showed that the integer method produces a build plan of more solar PV and wind than the annual build plan shows. The method also built more mid-merit gas resources per year, and fewer OCGT peaking resources. The sampled chronology method results in a build plan with less solar PV and wind, and more CCGT and OCGT resources annually. This methodology optimised CCGT and OCGT in most of the sites, and only built storage systems with long lead-times.
Although the integer sampled chronology had a significantly faster runtime than the linear relaxation sampled chronology method, when analysing the VRE production and load profile and build plan results, the linear relaxation sampled chronology offers a more optimal build plan and production and load profiles than the integer sampled chronology. Thus, the linear relaxation sampled chronology methodology for the JET far outweighs the use of the integer sampled chronology.
Using PLEXOS to run JET studies with linear relaxation sampled chronology will allow Eskom to make informed strategic decisions about its energy transition, while restoring adequacy to its power system in the future.

1 min read
How PLEXOS facilitates Ukraine's integration into Europe's power market Ukraine, Europe's second-largest country by area, is one of the most...

1 min read
Hydro Tasmania - Australia's Largest Generator of Renewable Energy Hydro Tasmania is Australia’s largest generator of renewable energy as well as its...

1 min read
Industrial and commercial energy users are becoming increasingly aware of the importance of managing their energy usage due to multiple factors, such...