 Rob Homer
1 min read
From AI to the OBBBA: 4 Drivers Reshaping the U.S. Power Grid
In Energy Exemplar’s recent webinar, Harnessing the Winds of Change: The Future of Green Energy in a Turbulent Present, Senior Product Manager, Rob...
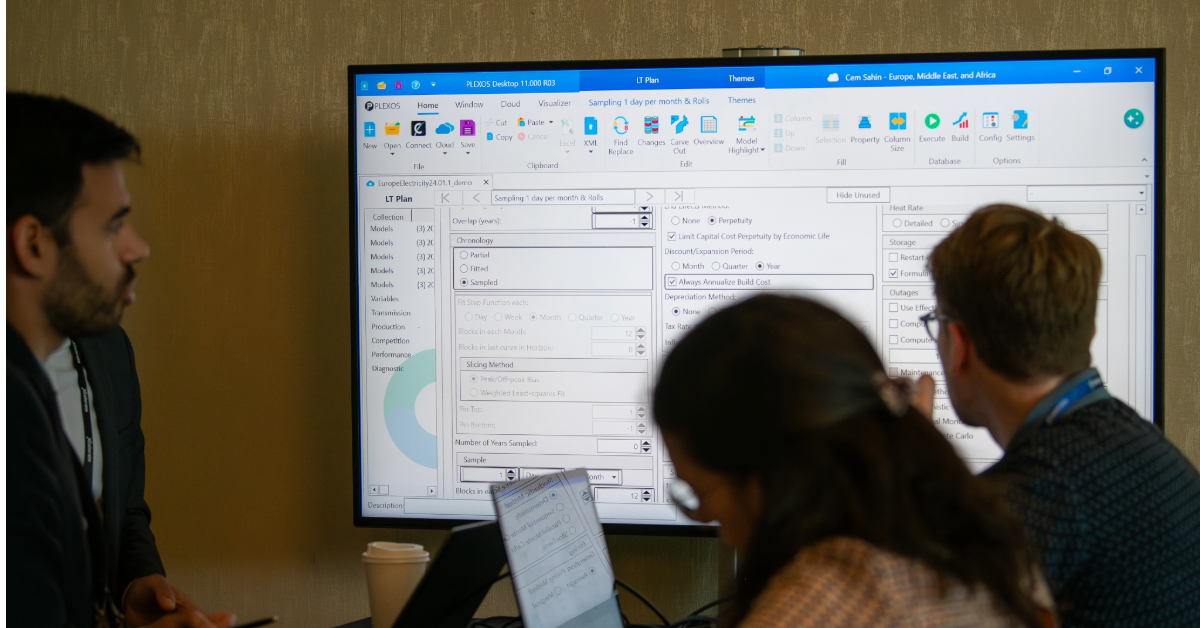
In Part 1 of this blog series based on our recent webinar, Harnessing the Winds of Change: The Future of Green Energy in a Turbulent Present, we covered the key drivers reshaping the U.S. energy landscape: rising AI-driven data center demand, growing reliability risks, backed-up interconnection queues, and the shift from Inflation Reduction Act (IRA)-era incentives to the new policy regime under the One Big Beautiful Bill Act (OBBBA). In this blog, we take a closer look at how these changes affect long-term generation portfolios — and how utilities and developers can use modeling tools like PLEXOS® to adapt.
The drivers of today’s energy landscape shift (AI-driven data center demand, reliability concerns, long interconnection queues and policy changes) will all impact generation portfolios in many different ways. However, as James Wade, Senior Energy Market Analyst at Energy Exemplar explained, the team at Energy Exemplar wanted to perform a PLEXOS analysis focusing on a single issue – and that is the impact of the OBBBA on the generation mix. Will the policy changes lead to fewer renewables? More gas? What impact might the OBBBA have on build and retirement decisions? How might system-wide generation costs be impacted?
To simplify things, this particular analysis excluded the explosive data center load growth we’re seeing right now and assumptions around new technologies. The analysis assumed fixed costs for renewables would continue to decline in line with industry forecasts.
Traditional wisdom would suggest that the OBBBA’s impact might include:
And these were the hypotheses going into the analysis.
The team opted to perform this analysis from the standpoint of a utility. Modeling assumptions included:
Because this is a utility focused analysis, the model did not include a market, or any reliability or capacity contribution analysis.
Simulation settings were:
These settings were chosen for the granularity they provide – they capture data points from all four seasons in a year. The rolling horizon also allows for a good balance between granularity and model runtime.
One of PLEXOS’ differentiating features is its ability to explore different sensitivities by using scenarios. To analyze the impact of the OBBBA, the team modeled four scenarios, two pre-OBBBA scenarios, and two post-OBBBA scenarios.
Figures 1 and 2 show installed wind and solar capacity in all four scenarios as modeled by PLEXOS.

Figure 1- Installed Wind and Solar Capacity: ITC Scenarios

Figure 2 – Installed Wind and Solar Capacity: PTC Scenarios
In terms of renewable buildout, the results show that in the period where tax credits are available, PLEXOS builds renewables fairly rapidly. When credits roll off, wind and solar investment also level off pretty immediately.
The results indicate that the OBBBA will reduce near-term solar and wind investment, but interestingly, the amount of wind and solar installed in the hypothetical utility is roughly the same in all four scenarios by 2050. This is because renewables continue to decline in price as advancements are made, making them economically competitive.
The above results indicated the PTC is more beneficial for this utility, so the next analysis honed in on the PTC scenarios. In the next analysis, the team focused on the capacity mix in the pre- and post OBBBA PTC scenarios. Figure 3 shows the pre-OBBA capacity mix, and Figure 4 shows the post-OBBBA capacity mix.

Figure 3 – Pre-OBBBA Installed Capacity (PTC Scenario)

Figure 4 – Post-OBBBA Installed Capacity (PTC Scenario)
Because this particular system has a good base of fossil and nuclear dispatchable generation, it’s easier to build out renewables on top. Thus, in the pre-OBBBA scenario, you can see more renewable build out – mostly consisting of wind projects, and solar coming into play towards the end of the study period.
The post-bill scenarios show wind built out in 2026 and 2027, then it pauses for a while, while still adding some battery storage, and resumes with solar installations around mid 2045.
Interestingly, the results show that at least for this particular hypothetical utility, the bill doesn’t have much of an impact on coal retirement decisions. In both scenarios, PLEXOS retires smaller coal units in 2026 and 2027. The gas generation build out is also surprisingly similar in both scenarios.
Another interesting outcome from the analysis comes from the build decisions PLEXOS makes in 2045 as a large nuclear unit reaches its scheduled retirement date. In figures 3 and 4 you can see that it replaced it with a mix of natural gas combined cycle units, solar, wind, and battery storage. This indicates that the system seems to value having a mix of generation sources that complement each other. Wade noted, “That illustrates something that I think is becoming more appreciated in our industry as renewables continue growing as a share of generation across the country – and that’s that generation sources are worth more together than individually.”
Once again, in both scenarios we see that the bill does reduce the near-term renewable generation build out, but in the case of our example utility, by 2050 the generation portfolio ends up being pretty much the same – what is impacted is the timing of renewable buildout.
Figure 5 shows the difference in total system cost between the pre-OBBBA and post-OBBBA PTC scenarios. Any value above zero indicates the bill added cost in that year, and values below zero indicate it’s reduced the total cost for the year.

Figure 5 – Added Cost from OBBBA
Post-OBBBA, the total generation cost does increase over the study period – particularly in the 2030’s and early 2040’s, when this utility previously would have been receiving significant PTC generation credits. So, as hypothesized, the shorter runway for tax credits does increase generation costs overall. Towards the end of the study period, the generation cost returns to a similar cost as today and is in fact slightly cheaper under the OBBBA than at present. The total increase post-OBBBA amounted to approximately a 6% average on an annual basis over the entire study period.
The results of this analysis are nuanced – some assumptions were left out and the scenarios could look different given different generation portfolios, load growth, geographies, etc. However, the study highlights the different future scenarios that PLEXOS allows system operators, utilities, renewable developers and more to explore – gleaning the information and data necessary to make informed, data driven decisions.
1 min read
In Energy Exemplar’s recent webinar, Harnessing the Winds of Change: The Future of Green Energy in a Turbulent Present, Senior Product Manager, Rob...
1 min read
EirGrid and Mott MacDonald: Preparing Ireland's power system for a net-zero future
1 min read
Achieving net zero emissions by 2050 will require a complete transformation of the global energy system. In the IEA's pathway to net-zero, almost 90%...