Model with confidence
Natural Gas Fundamental Datasets for PLEXOS®
Portfolio models and technical analysis of the natural gas market often struggle to forecast the impacts of structural change because they use historical outcomes and “norms” to predict the future.
That's why Energy Exemplar has developed gas fundamental datasets for PLEXOS, which provide a detailed, calibrated, out-of-the-box simulation of how the gas market operates. The datasets are designed to be easily customized, so Users can run multiple scenarios and sensitivities to further understand key drivers and model potential future market outcomes. Model the entire gas ecosystem in a single platform to understand future market trends in the increasingly complex low carbon economy.
Gas markets across the globe are experiencing fundamental change
Answer billion-dollar questions with unprecedented clarity

Regional Policy Impact Analysis
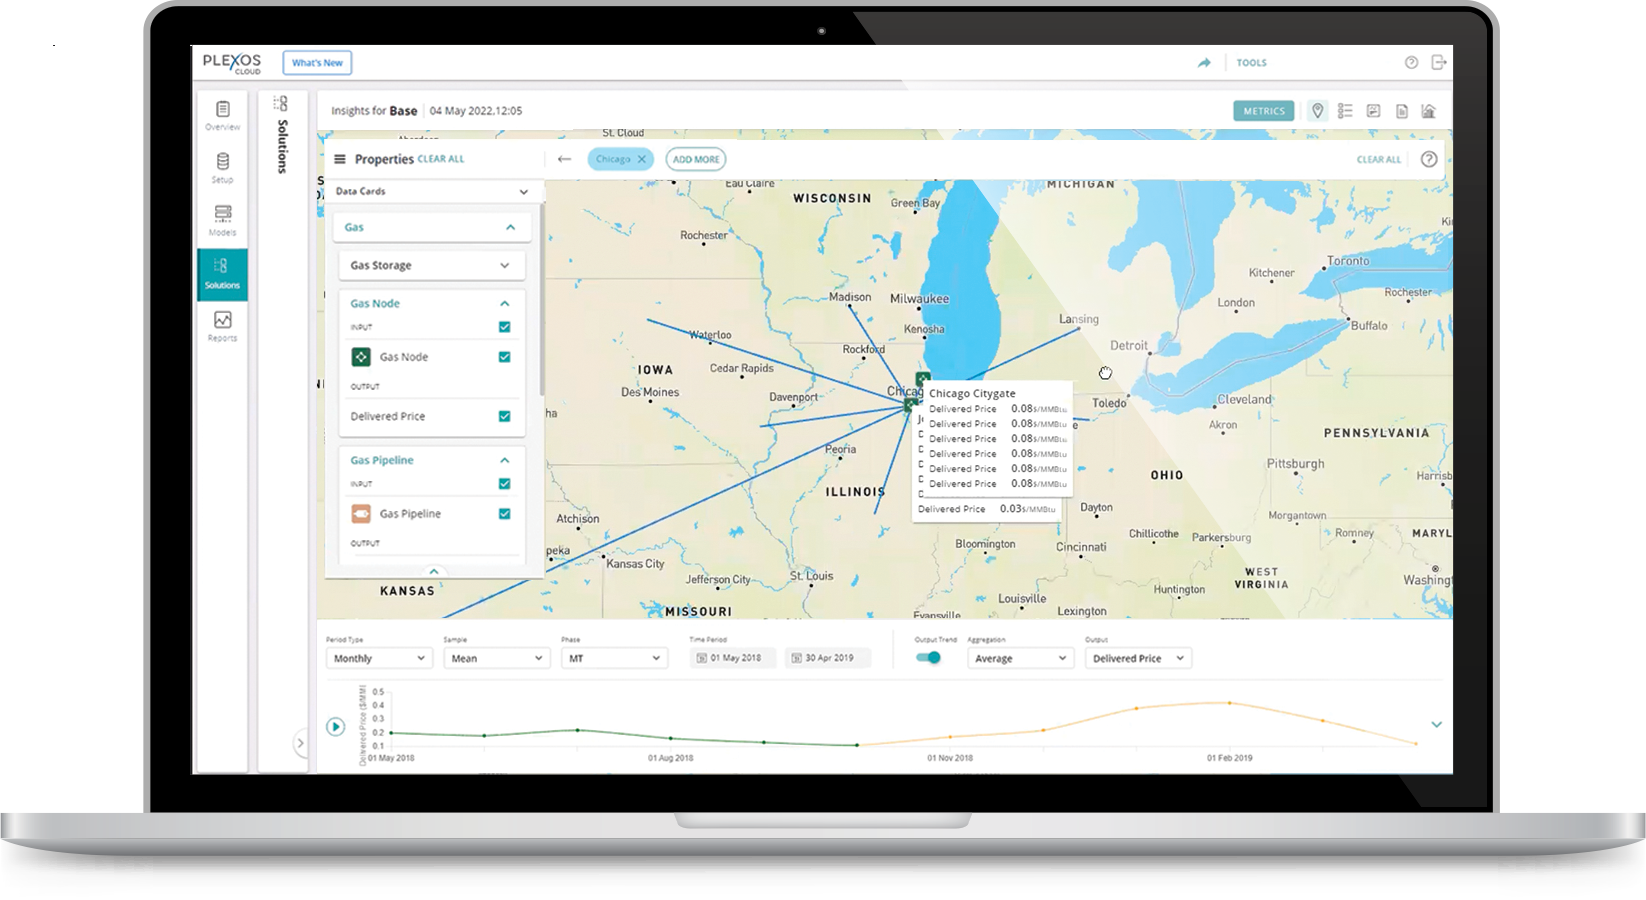
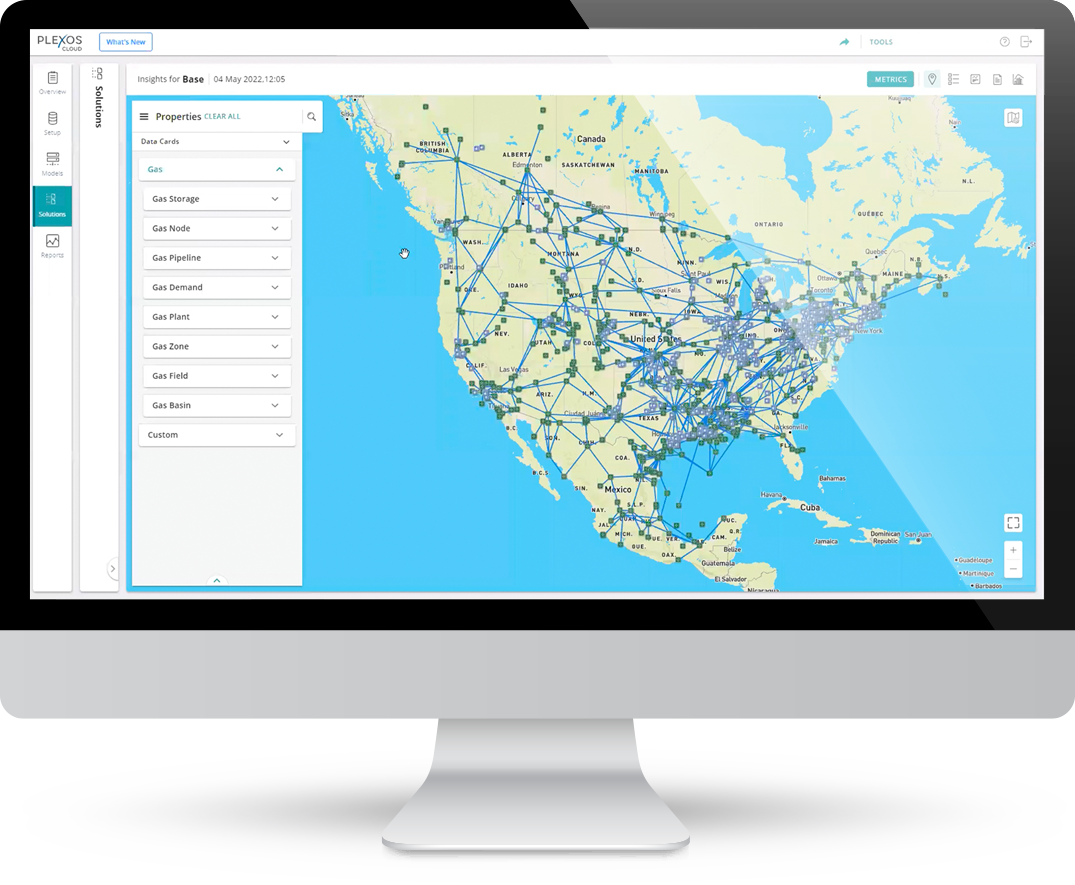
PLEXOS Gas captures the entire infrastructure of the North American, European, and Asian Gas network along with the capabilities to model carbon emissions, energy storage, renewable natural gas, and hydrogen.

Transparency into market uncertainties
Model and understand the impacts of transportation bottlenecks, infrastructure development, weather, market pricing and technology trends – including future scenarios of potential market outcomes to 2050

Infrastructure Investment insights
Right size your infrastructure to account for the entire gas ecosystem including existing and future expansions for gas processing plants, pipelines, storage facilities and LNG plants.

Gas Hub Price Forecasts
Accurately model beyond published futures and examine the impacts of extreme weather events or unplanned outages to key assets.
Learn More about Regional Datasets
Detailed representation of gas market infrastructure and fundamental market drivers
Simulate the interplay of gas supplies, pipeline flows, storage inventory, and pricing modeling the primary characteristics of the natural gas industry and easily modifying assumptions from weather to pipeline maintenance and availability.
Zoom into the map, where you can analyze individual nodes such as the Chicago city gate to analyze price changes overtime.


Analyze pipeline flow across the entire network.
Analyze congestion's impact on pricing across the entire network or a specific pipeline.


Gas storage and gas price arbitrage
Analyze inter-hub pricing and future forecasting by zooming into detailed pricing at the hub level, with daily-level granularity.

Regional Gas Datasets
Introducing our PLEXOS dataset for the North American Gas Market. This fundamental dataset is the most comprehensive view available of the entire gas ecosystem – giving you what’s needed to understand future LNG export and imports; all supply scenarios; the impact of changing demand patterns; fundamental gas price analysis; and so much more. And in this era of unpredictability and critical questions surrounding the global gas market, this timely dataset release can help you uncover insights that weren’t previously possible.
Model components include:
- 147 Price Hubs + Interconnects
- 379 Underground Storage Facilities
- 165 Supply Nodes
- 43 International Border Points
- 18 LNG Terminals (export and import)
- 508 Demand Nodes
- 172 Interstate/intrastate pipelines including 1600 gathering, interstate and intrastate pipe segments
- Reporting available by sector, census region, census divisions, state/province or country
Stay ahead of the market transition
European Gas Dataset
Introducing our latest dataset for PLEXOS to aid with European gas use cases. This fundamental dataset provides an up-to-date view of the entire gas market ecosystem, giving you what’s needed to understand demand/supply balance; security of supply; market prices; and much more. And in this era of extreme uncertainty, this timely dataset can provide peace of mind by allowing you to uncover almost any gas scenario and its impact on your operations or investments.
Model components include:
- A fundamental view of European gas market drivers – production, LNG, imports, storage, flows and prices
- A detailed daily market simulation of how the European gas market operates.
- Historical calibration – backcast against market actual data from 2019 – 2022
- Out-of-the-box future scenarios of potential market outcomes to 2050