 Dr. Jaakko Jääskeläinen
1 min read
How Digital Modeling Solutions can Improve the Asset Siting Process
As energy market participants work to keep up with an ever-increasing demand for electricity, asset siting — or the strategic placement of power...

The Nordic power market is intriguing with all its distinct characteristics. For example, due to its cold climate and energy-intensive industries, demand for power is high.
In addition, almost all thermal capacity in the region is operated according to the need for either industrial or residential heat, and there are notable bottlenecks within the region. Moreover, a vast majority of the production mix (mainly hydro, nuclear, and wind) has very low short-term marginal costs.
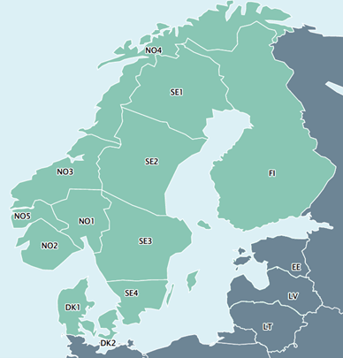
The Nordic market consists of Norway (NO), Sweden (SE), Finland (FI), and Denmark (DK), which are further divided into 12 bidding zones (figure below) due to the bottlenecks within the region. And yes, Iceland is a Nordic country, but as it is separated from the other countries by a thousand kilometers of sea, it is not considered here.
 In 2021, the total electricity generation of the four countries was 408 TWh (NO 155, SE 163, FI 64, DK 26) according to ENTSO-E Transparency Platform. Generation mixes of the countries are presented below.
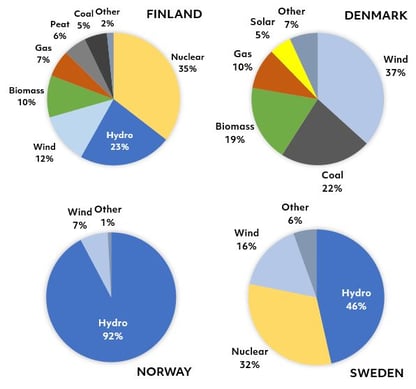 As can be seen from the generation mixes, hydropower covers a significant share of the region’s production, particularly in Norway and northern Sweden (SE1 and SE2). The region comprises thousands of hydropower generators with over 50 GW of installed capacity in total and approximately 200 TWh of annual generation (~50% of the region’s total), depending on the hydrological conditions.
2021 was not a wet year, particularly not in southern Norway, but the total Nordic hydro generation still amounted to over 230 TWh. This is due to the exceptionally high wholesale prices, which encouraged the use of stored water in reservoirs. The Nordic hydro reservoir capacity is close to 125 TWh, of which some reservoirs are capable of storing large amounts of energy for multiple years. This feature, unique in this magnitude in Europe, is highly advantageous in respect of system balance and the integration of significant amounts of wind and solar energy into the system, but it comes with a huge mathematical challenge for energy system modellers.
Day-ahead market prices (and the corresponding energy market modelling) are generally based on short-term marginal costs of power production. What makes hydropower interesting, particularly the units with storage capacity, is that there are practically no short-term marginal costs (fuel or other operational costs), but there is a fundamental opportunity cost involved. In practice, the question becomes: “What does it cost me to produce today, compared to the price I might receive tomorrow, next week, or even next year?” A Nordic proverb states that a beloved child has many names, and so does this opportunity cost: water value, shadow price, and future cost function, to name a few.
The more there is flexibility to postpone the generation, the more the involved uncertainty grows. Hands up: Who predicted the price collapse of 2020 already in 2019? Or the skyrocketing prices of 2021 during the bleak sentiment of 2020? Hence, hydro producers constantly need to bid their electricity with a probabilistic view of the future. This is called stochastic optimisation or modelling. There are multiple ways to approach stochasticity: The first is the two-stage approach, where you make a decision without the knowledge on how the future will unfold, and don’t adjust the decision anymore afterwards. An example of this is a power plant investment: If you decide to build a power plant in a given year, it’s often not sensible to decommission it in the following year.
Energy Exemplar’s Data Analytics team released a Nordic Dataset in September 2021, after which we have been further developing the Nordic hydro capabilities. We have been working diligently on applying PLEXOS’s stochastic multi-stage modelling capabilities to our Nordic model, which we are excited about. We have also learned that different use cases require different levels of modelling sophistication and data. For example, studying the detailed day-ahead price coupling in the Nordic region and assessing the feasibility of a transmission line investment between hydro-rich southern Norway and continental Europe have very different requirements. Let’s dive a bit deeper into the former use case.
The figure below presents the hourly day-ahead prices from northern Sweden (SE1), Finland (FI) and Estonia (EE) from 24–28 January 2022. SE1 is a surplus producer with notable hydro reservoirs and a lot of wind, whereas the price in Estonia is most of the time set by old oil shale units. Finland lies between these bidding zones, typically importing from SE1 and exporting to EE. As can be seen from the graph, the price in SE1 seems to set the lower boundary to Finnish price, whereas EE sets the ceiling. The Finnish price then happily fluctuates between these boundaries.
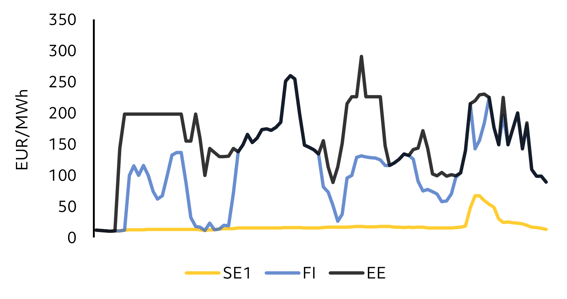
In order to assess the price development in Finland, there needs to be an understanding on how hydro producers in SE1 value the water in their reservoirs, what the supply curve in Estonia looks like with the current commodity prices, and how the bidding zones couple or decouple. This is a highly complex task and very difficult to understand without a detailed and well-calibrated fundamental market model such as PLEXOS.
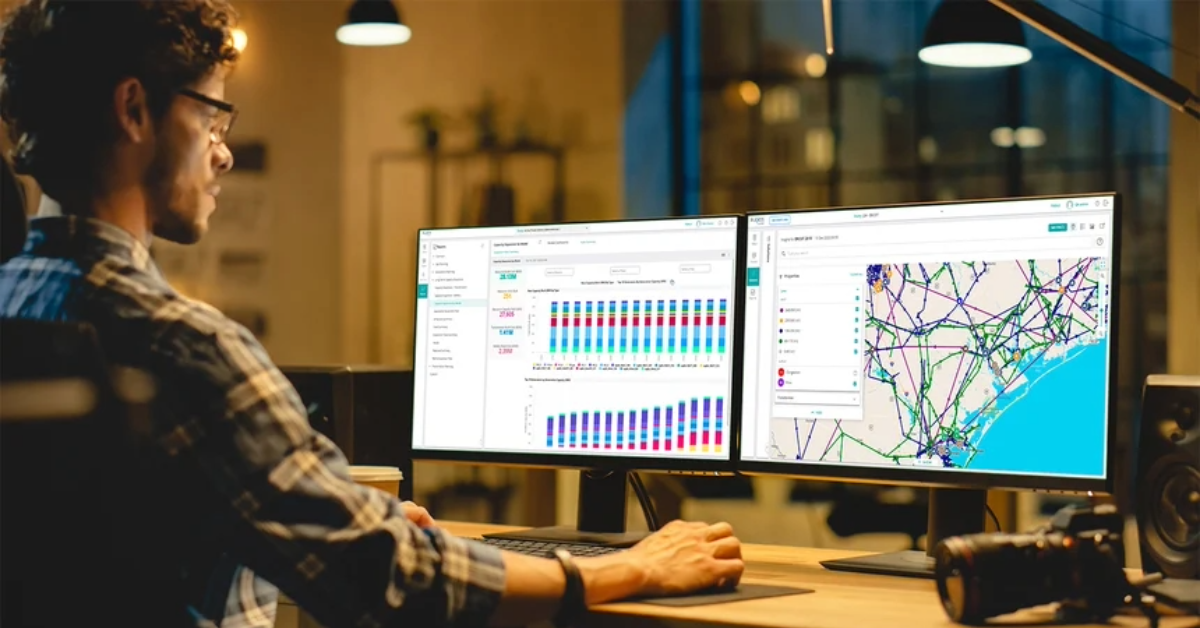
The figure below shows two excerpts from Energy Exemplar’s Data Team’s Datasets: First, the graph on the left presents the hourly price results of a deterministic model run, where we can see the dynamics between Finland, Estonia and northern Sweden as were described earlier. On the right, we can see from another model run, how the Estonian day-ahead price on a given period would have materialised under different weather conditions. Samples 1–5 present different weather years, having consistent wind, solar, hydro and power demand assumptions, whereas the sixth sample represents the average outcome of all the included weather years.
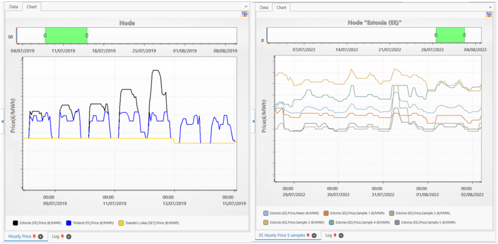
Thus, PLEXOS allows for easy ‘what if’ scenarios to analyse the sensitivities of any applied input parameters and hence a more thorough understanding of energy markets than just an answer to the question “What happened?”.

1 min read
As energy market participants work to keep up with an ever-increasing demand for electricity, asset siting — or the strategic placement of power...
1 min read
It's been an exciting and productive year for Energy Exemplar, and now that it's almost over, we'd like to reflect on what was accomplished. From...

1 min read
The European gas market is going through a transformational period of volatility and uncertainty. The catalyst for the current events is tragic and...