Accurate portfolio risk assessment requires a holistic and integrated view of energy markets (including electricity, natural gas, water and, transportation) and an understanding of how each facility within a portfolio impacts the entire portfolio.
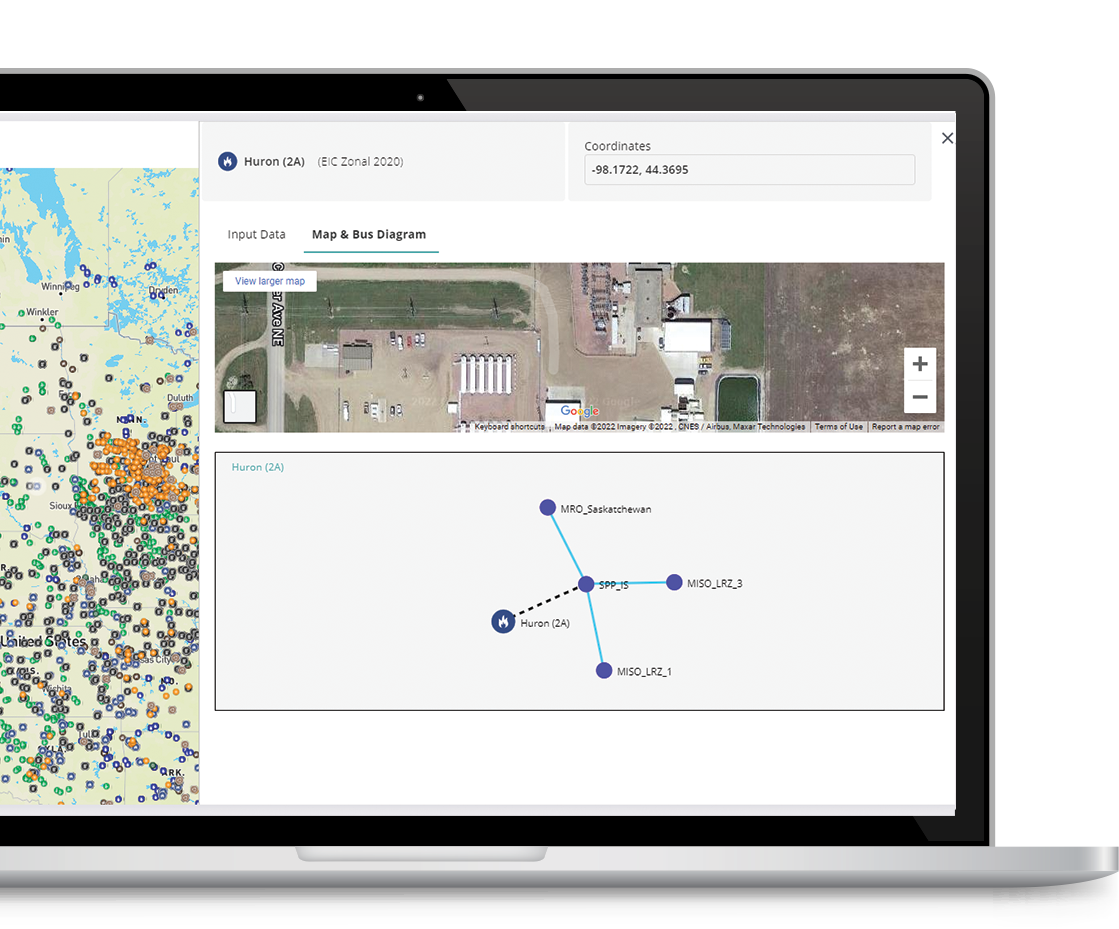
PLEXOS provides the power to understand the entire energy topology in North America and geographically map every project in your portfolio. Understand how new projects can complement or interfere with existing portfolio revenues—model gas price fluctuations to plan operating costs or analyze site-specific distribution and transmission levels.
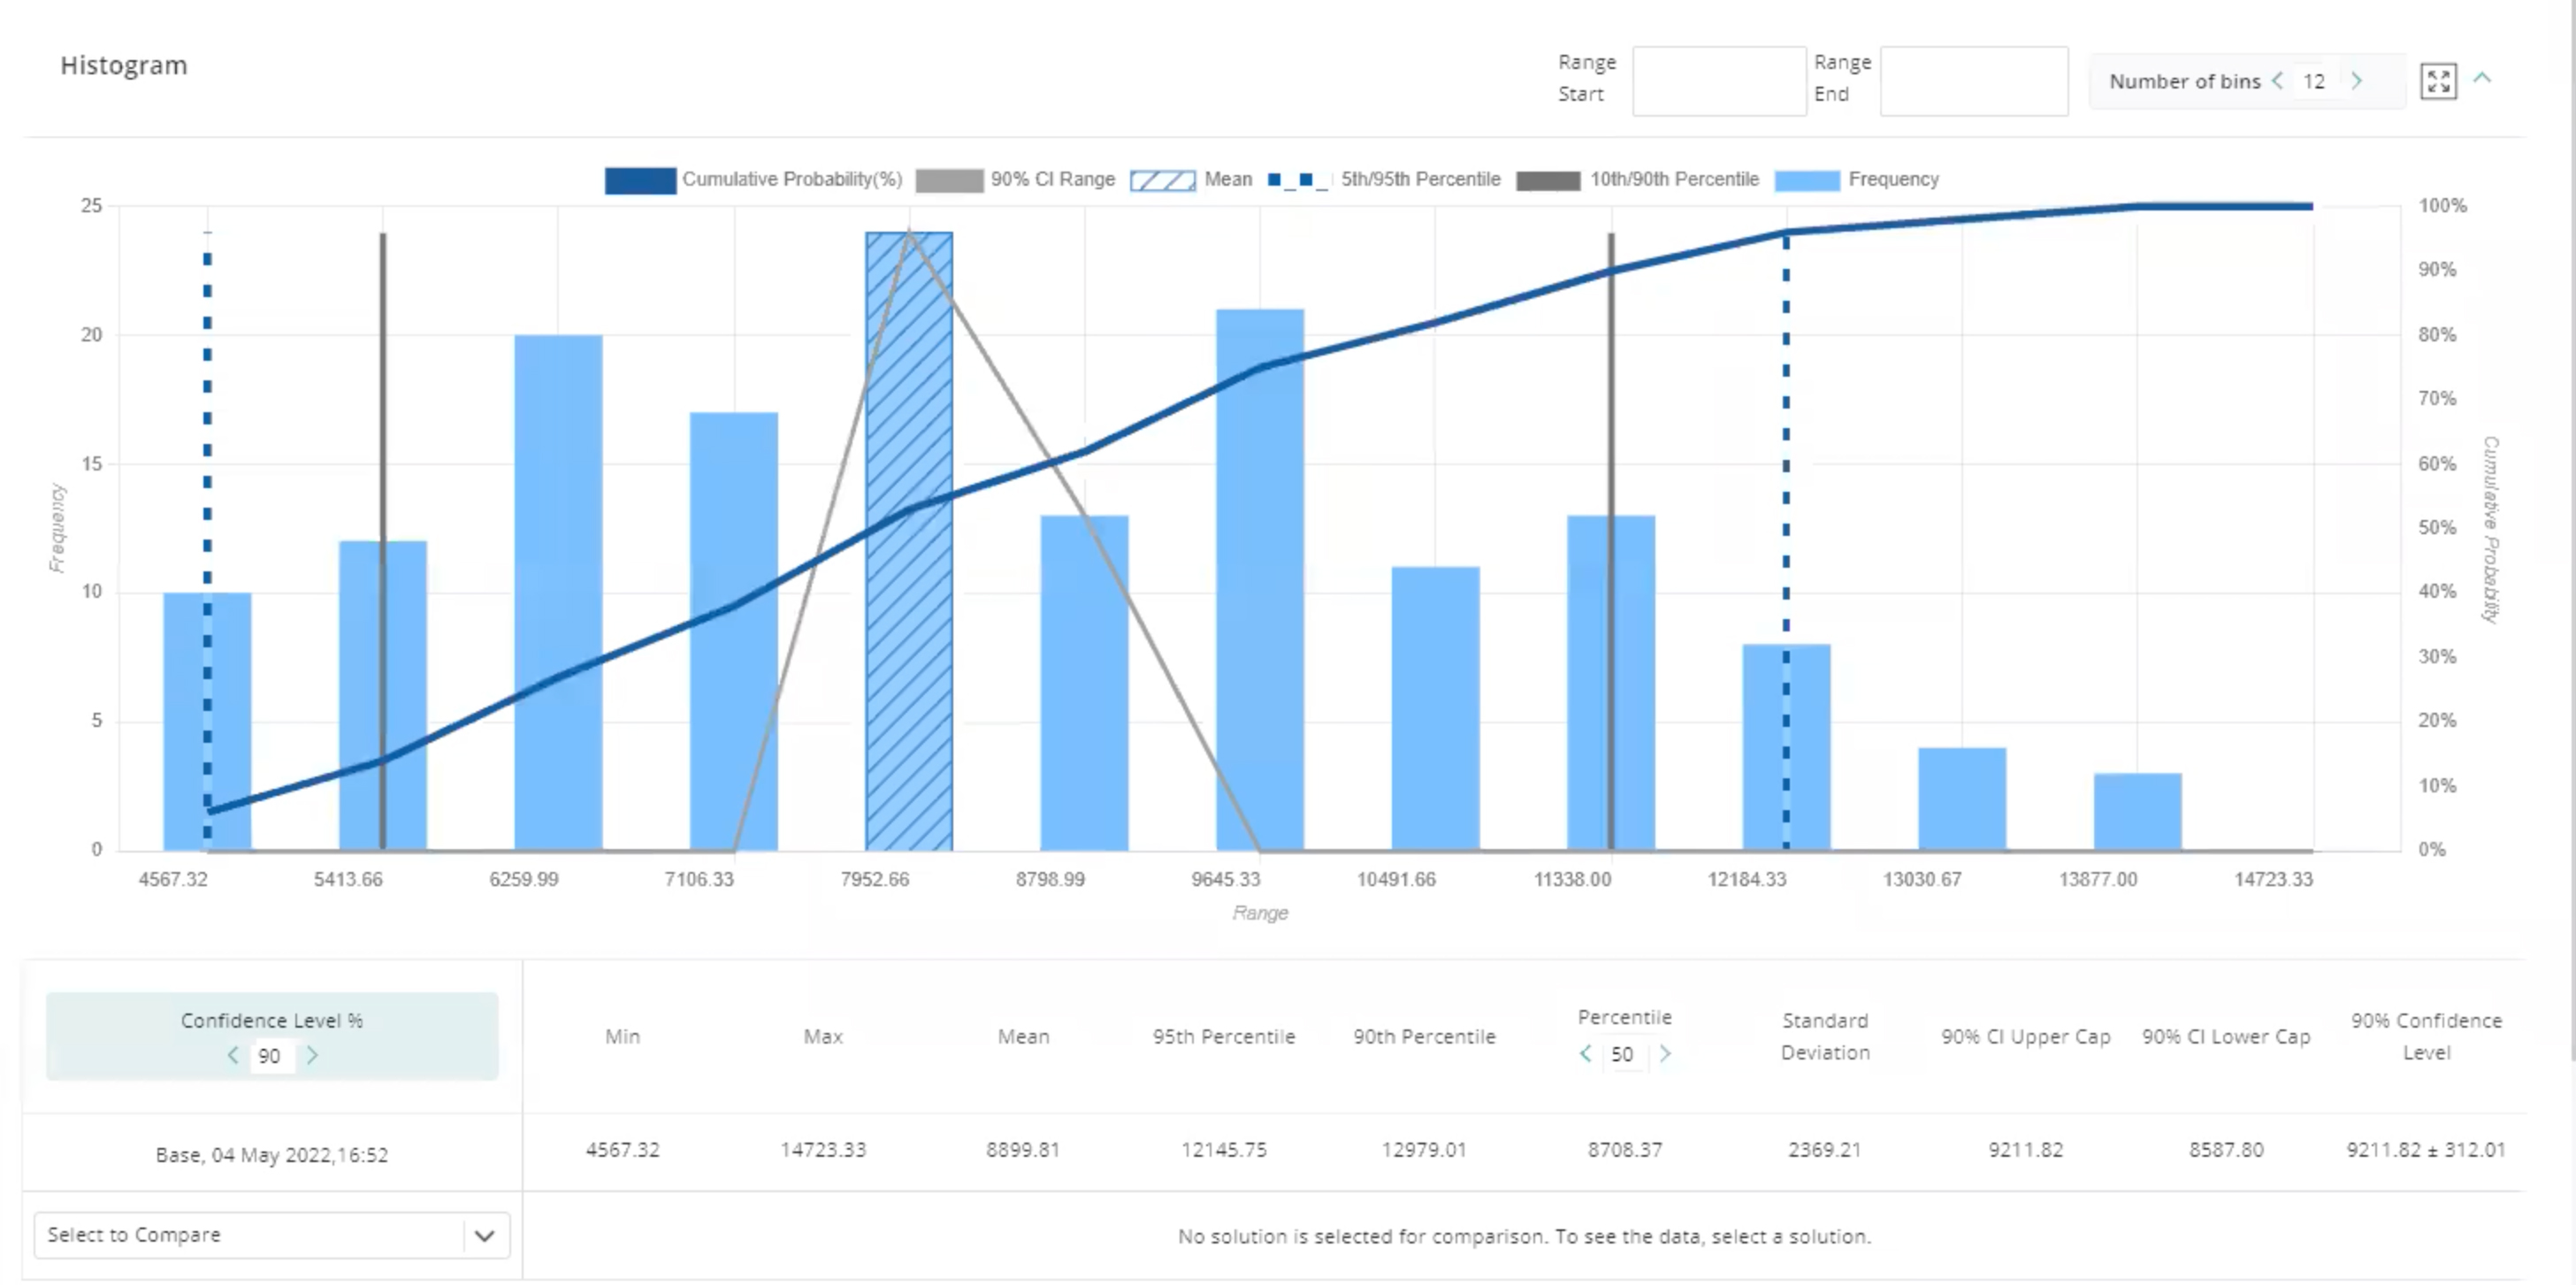
In this scenario, we assume that revenue is a function of market price and generation profile. We then run a Monte Carlo simulation and create a histogram around these two factors.
After selecting an expected price and generation profile, we input a standard deviation to determine the level of uncertainty we expect from the profile.
PLEXOS runs a Monte Carlo sensitivity analysis to generate the portfolio's risk probabilities. The resulting histogram shows the likelihood of revenue including best- and worst-case revenue projections.
You can assess the projected revenue probabilities across an entire lending portfolio, a geography, or individual asset.