1 min read
What's New - January 2024
Our monthly update highlights several key developments in our platform focusing on user experience, efficiency and security. The release of PLEXOS...
5 min read

The North American gas market is a complex and evolving landscape, characterized by a myriad of factors that influence both supply and demand. From weather patterns to infrastructural developments, each element plays a crucial role in shaping the market dynamics. In this intricate environment, the ability to anticipate and adapt to changes is invaluable. This is where advanced scenario analysis comes into play.
Scenario analysis serves as a powerful tool for understanding the potential impacts of various market conditions. By simulating different situations - such as weather events, infrastructural changes, or economic shifts - we can gain insights into how these factors might affect the gas market.
Scenarios are a great way to model changes to your base case without overriding base case inputs or assumptions. One or more scenarios can be modeled and tagged in PLEXOS to compare against the base case. A variety of scenarios help analyze the directional movement of natural gas prices and flows given a variety of real-world scenarios such as weather events and pipeline/infrastructure outages.
To better understand the intricate dynamics of the North American gas market, we utilize PLEXOS – Energy Exemplar's powerful simulation platform. PLEXOS allows for detailed modeling and analysis of energy systems, offering insights into how different factors interact within these complex markets.
Weather data can be used to analyze the impacts of changes in weather on demand in the commercial and residential sectors, both on a monthly and daily time scale. Gas demand can be defined either by an exogenous forecast of demand, or by using a combination of weather data and usage factors. Usage factors are linear regression functions that calculate demand. Using weather (temperature, wind speed, heating degree day (HDD), etc.), the user can create demand forecasts from weather input data and regression coefficients. Using the weather station properties, users have the flexibility to model a variety of weather assumptions, economic growth assumptions or world oil price assumptions using regression-based analysis.
When running with weather assumptions, demand for natural gas is tied to a regression-based correlation of average temperature data obtained from NOAA. The HDD data is regressed against historical demand, resulting in correlation parameters that are entered into the PLEXOS dataset. Properties in the released dataset are based on normal weather assumptions (HDD data and 10-year normal weather forecast) input by state. Users can model different scenarios, including those listed and analyzed below.
In this scenario, HDD input data was reduced using an extreme multiplier of 0.7 to simulate the effects of a warm winter for the months of November - March in the forecast period. This reduces the HDD for the winter by 30% compared to the base case.
In this scenario, the HDD input data was increased by an extreme multiplier of 1.3 to simulate a polar vortex winter. This scenario increased HDD by 30% indicating a significantly colder winter, requiring a larger amount of gas for heating purposes in the residential and commercial sectors in the winter months.
Using a monthly regression model, both scenarios were run against the normal winter base assumptions to produce the following results for Henry Hub prices. As expected, for the months of November – March, the PLEXOS forecast prices are higher in the cold winter scenario, and lower in the warm winter scenario as compared to the normal winter base case (Figure 1).
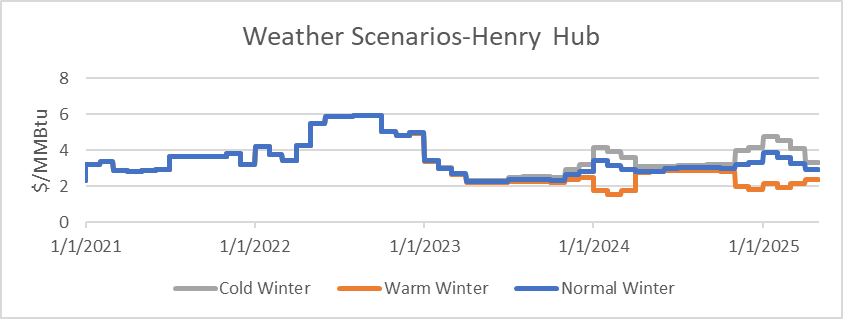 Figure 1: Weather Scenario (Warm and Cold Winters)
To represent a 30% increase in gas demand for power generation over the base case, an extreme multiplier (of 1.3) was used to modify all the (exogenous) electric power demand from the base case in the forecast period. This was done by modifying the demand input csv files for the summer months in the forecast period. As expected, PLEXOS forecasts an increased price in summer months compared to the base case when the higher electric power demand is used. 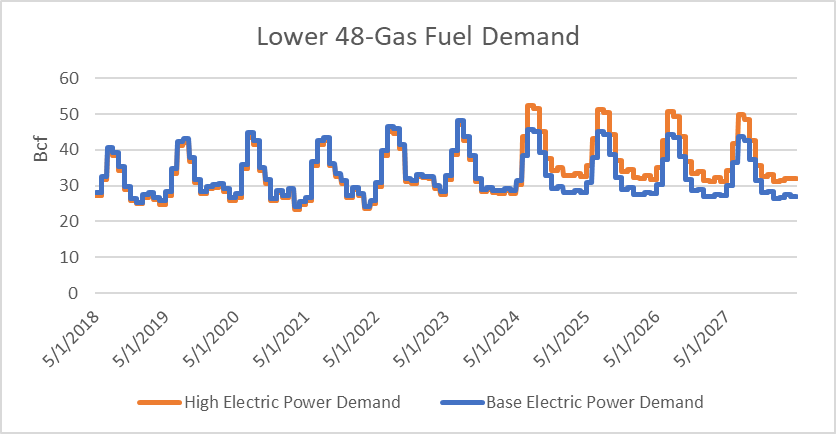
Figure 2: High Gas Demand in Summer for Power Generation 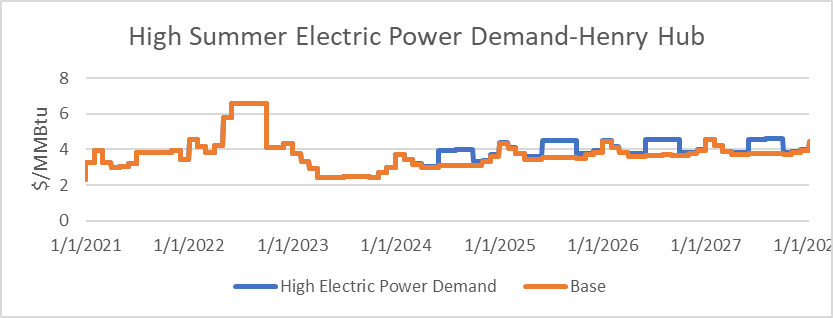
Figure 3: Gas Price Rise during hot summer months
Another set of scenarios that can be assessed using the model is to simulate an outage (forced or maintenance) on a pipeline or key piece of infrastructure such as a Liquefied Natural Gas (LNG) terminal. PLEXOS gives the ability to implement a forced outage or maintenance schedule, or one can manually enter capacity changes during certain date ranges using the Max Flow Day property and scenarios.
In this scenario, we reduced the capacity of the Sabine Pass LNG terminal by 75% for the month of August 2024 to see if the model would respond as desired to such a significant reduction in LNG demand. The scenario was run with perfect foresight on a monthly MT schedule, as was done in the base case.
The outage scenario results show that flow at the Sabine Pass LNG Feed gas node goes to zero during the month of August and there is a shortage at the corresponding Sabine Pass LNG FOB node where the demand sits, causing a price spike on the LNG FOB node (LNG Export point in dataset). This outage also causes a drop in price at hubs neighboring the feed gas hub that now have more gas flowing to them due to a shutdown of Sabine Pass feed gas flows. These include Henry Hub, Transco Z3 and Gillis. The average price drop is about $0.25 for these hubs for August, as shown in Figures 4 and 5. The impact is not as severe as at the Sabine Pass node due to optionality and other supply from the numerous pipelines that traverse through these hubs. 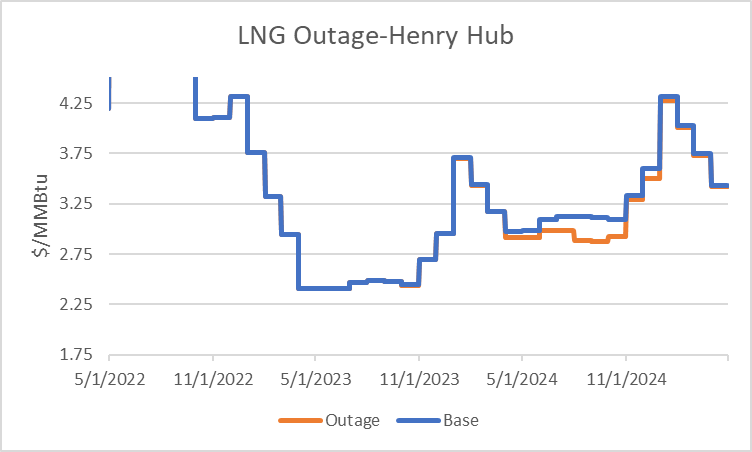
Figure 4: LNG Outage Scenario – Price Drop at HH (Henry Hub) during outage ($/MMBtu) 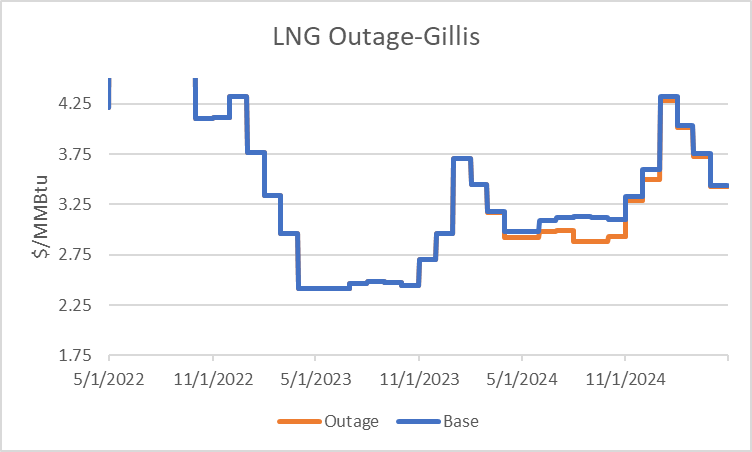
Figure 5: LNG Outage Scenario – Price Drop at Gillis during outage ($/MMBtu)
In this scenario, a pipeline outage was simulated by reducing the Max Flow Day capacity on the El Paso and Transwestern Pipe segments feeding the SoCal Border Needles/Topock node over a 2-week period - from 11/1/2024 - 11/15/2024 - by approximately 70%. The model was run with a Daily MT schedule, with perfect foresight disabled. The model generates expected results by demonstrating a price spike at the SoCal Border Needles/Topock node during this two-week period as shown in Figure 6. 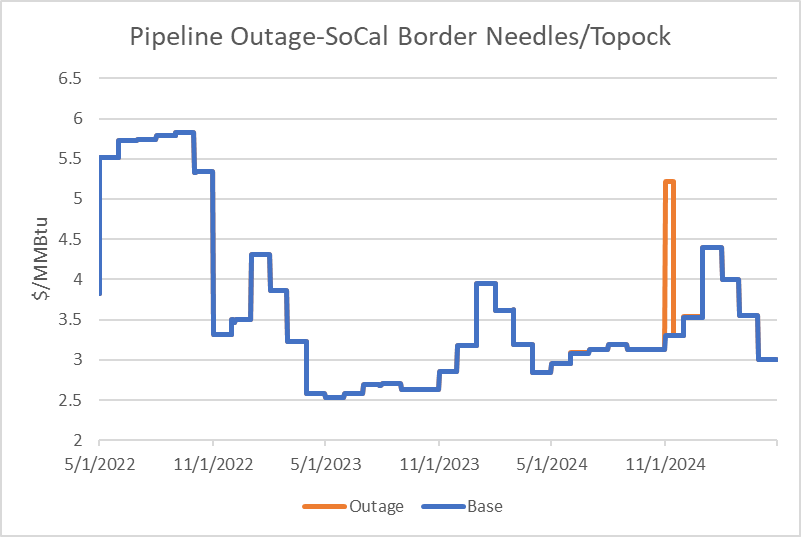
Figure 6: Pipeline Outage Scenario – 2-week outage on El Paso Pipeline, Price Rise($/MMBtu)
In this scenario, a pipeline outage was simulated by reducing the Max Flow Day capacity on the Westcoast pipeline feeding the Huntingdon and Sumas border nodes, from 11/1/2024 - 11/15/2024, by 40%. The model was run with a Daily MT schedule and perfect foresight disabled. The model generates expected results by demonstrating a price spike at the Northwest Sumas and Sumas border node during this two-week period as shown in Figure 7. 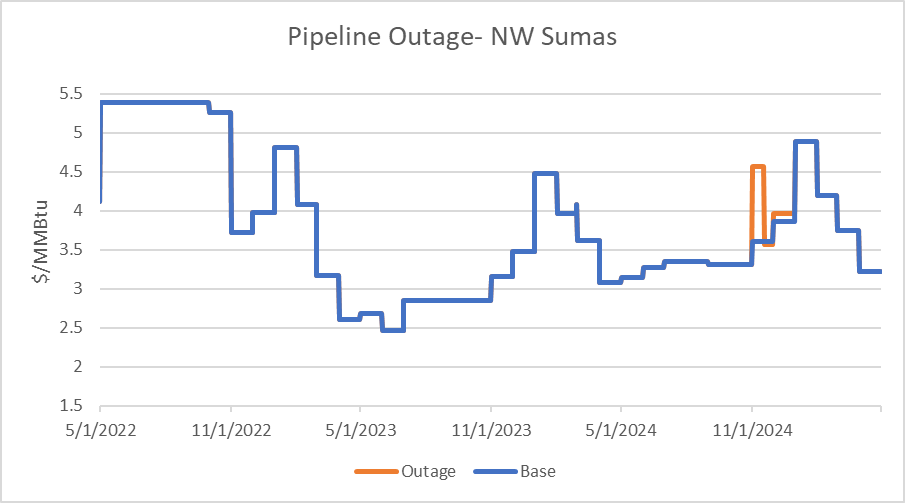
Figure 7: Outage Scenario - Price drop on Westcoast pipeline ($/MMbtu)
The scenarios outlined above not only demonstrate the versatile applications of the PLEXOS North American Gas dataset but also hint at its potential for shaping future market strategies. By simulating various market behaviors, this tool provides valuable insights that can guide decision-making in an ever-evolving energy landscape. Whether for short-term forecasts or long-range planning, the ability to accurately predict market outcomes and their effects on gas prices and flows is crucial for staying ahead in the dynamic world of North American gas markets.
Are you looking to navigate the dynamic world of North American gas markets with greater confidence? Explore our full range of analytic tools and resources and lead the way in energy market strategies.
TECHNICAL TERMS GLOSSARY
HDD (Heating Degree Days): This is a measure used to estimate the energy demands for heating. It's calculated by subtracting the average temperature of a day from a base temperature (usually 65°F). Higher HDD values indicate colder weather and higher heating needs.
LNG (Liquefied Natural Gas): LNG refers to natural gas that has been converted to liquid form for ease of storage and transport. It's an important aspect of the global gas supply chain.
MT (Monthly MT Schedule): In the context of PLEXOS simulations, 'MT' typically refers to a scheduling parameter. A 'Monthly MT Schedule' means the model runs and forecasts are updated on a monthly basis, providing regular insights into market dynamics.

1 min read
Our monthly update highlights several key developments in our platform focusing on user experience, efficiency and security. The release of PLEXOS...
1 min read
Each month, we highlight the latest enhancements made across the PLEXOS® platform to help you model faster, plan smarter, and collaborate more...
1 min read
Energy markets are moving faster than many teams can analyze them. Forecasts shift. Renewables move. Constraints bind. Fuel prices change. New...